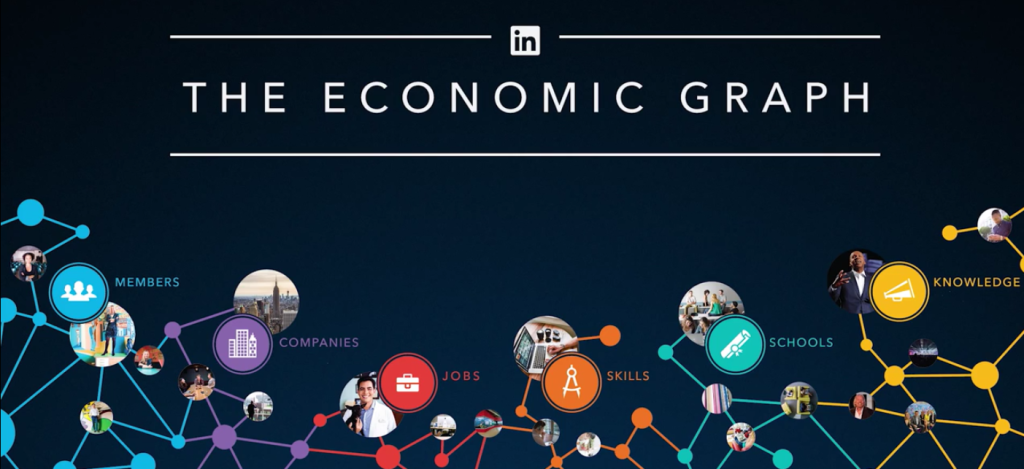
Possibility: By 2025, LinkedIn’s Economic Graph will be its most important commercial product and widely seen by policy-makers and pundits as the most insightful economic, education and social policy tool in the world as it helps us confront challenges of unemployment, skills gaps and creating a positive culture of an engaged workforce.
Economic Graph: A Techno-Optimistic Vision to Believe In
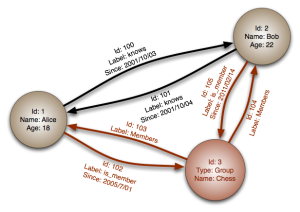
LinkedIn is best known as an online place to manage our work resumes and be discovered by a new employer. LinkedIn’s secret sauce is connected data that allows us to create connections with people and organizations across our work life. This information is often referred to as our professional graph — and is stored in a graph database model (e.g. Neo4j; OrientDB) that emphasizes the relationships between entities.
To earn money LinkedIn sells access to premium versions of this professional graph to recruiters seeking the right talent and to job-seekers looking for personal connections into desireable companies.
LinkedIn’s new vision to create an Economic Graph data model of the people, networks and knowledge that can ‘create economic opportunity for every member of the global workforce’.
To achieve this vision, LinkedIn must overcome challenges of scaling our ability to connect insights on skill sets, job descriptions, real world job performance and unmet needs of organizations and regions around the world.
LinkedIn imagines a future where it connects network knowledge – not just people. Given their acquisition strategy it seems clear that the vision for an economic graph model was embedded within the company long ago.
What were signals from the recent past?
In 2012 LinkedIn acquired Slideshare the world’s most popular professional content site that allows professionals to showcase and demonstrate their actual work. This gives LinkedIn a peak at content and knowledge sharing across professional networks.
In 2014 the company funded research by Michael Mandel suggests value of Report: Connections as a Tool for Economic Growth.
In 2015, they acquired online training company Lynda for $1.5B in a move that suggests LinkedIn is moving closer to filling skills gaps.
In 2015 the company launched and announced – not one – but eleven ‘winners’ for the The Economic Graph Challenge – designed to encourage innovations on the platform. Clearly it has wide open arms to innovative groups that might use the connected data within the Economic Graph for deep insights.
Oh, the questions we might ask
The Economic Graph will allow us to ask new types of questions that might be hard to consider or answer today.
Individuals will be able to ask new types of questions about the path to sucess. (e.g. What certifications or experiences are in most demand in particular organization or industry sector? What job position pathways are most common for x-leadership roles? What regions have companies seeking my set of skills? )
Mayors will be able to ask questions of their workforce and see connections or gaps to affiliated schools and training institutions. (e.g. Where did our most successful workers come from? What skills do they have? Where did they acquire these skills?)
Is this more techno-babble?
The Economic Graph is 100% techno-solutionism and by any measure of its memetic virality — is well below the radar of potential evangelists and blog posts with legitimate (though short-sighted) criticisms of algorithmic bias. I can see Evgeny Morozov grabbing hold of this one and making LinkedIn his next target.
For myself, LinkedIn’s efforts thread together more than a few of my current obsessions:
— lifelong learning and performance support via ExperienceAPI (#xapi),
— emergence of semantic data models and knowledge graphs;
— City Mayors as new catalysts of social change.
Learn More Below

Challenges?
Beyond the technical challenge of scaling. Single greatest challenge might be in getting people to see value of LinkedIn beyond ‘setting up a profile’ and ‘networking’ to using LinkedIn as a platform to share their professional learning journey.
Can we understand — as an MIT Group suggests — the ‘economic genome’ of cities which can bring success?
Questions I am interested in exploring with the Economic Graph
ExperienceAPI – LinkedIn embraces ExperienceAPI and Learning Graph as key enablers for workplace transformation
Learning Graph – Could LinkedIn become the company who makes a skills or learning graph standard for workforce culture?
Clients – Could LinkedIn’s contracts soon become national governments? Colleges?
College Students– How will LinkedIn position their services for talent just entering the workforce – and not yet at a level of experience where they should or want to share knowledge?
Learn more about LinkedIn’s Economic Graph
Five minute video introduction of Economic Graph (2015)
CEO Jeff Weiner – The Economic Graph (2014)
This clip starts at min 10 with the Economic Graph but recommend starting at beginning to watch the entire presentation for context.
Referenced to Economic Graph comes later in deck (slide 40)
Co-Founder
This clip starts at min 20 with a different angle on the economic graph and professional workforce (3.3 billion)
Slideshare (owned by LinkedIn) clips on Economic Graph
Short interview with Srinath Shankar – member of Economic Graph team
2014 Report
Want to go deeper with a technical presentation?

